The Complete Guide to Building Scalable Web Applications in 2025
Master web application scalability in 2026. Learn architecture patterns, database optimization, load balancing, and cloud deployment with real code examples.
Hasan Wazid
Every successful application faces the same challenge: growth kills unprepared systems . The Reality of Scale: Your app launches → 100 users → everything works perfectly Product goes viral → 10,000 users overnight → serv...
Too long? Ask AI to summarize
Get a quick summary of this article using your favorite AI assistant
Why Scalability Isn't Optional in 2026
Every successful application faces the same challenge: growth kills unprepared systems.
The Reality of Scale:
Your app launches → 100 users → everything works perfectly
Product goes viral → 10,000 users overnight → servers crash
Customers leave → negative reviews → recovery costs 10x more than building right initially
Real-World Impact:
Cost of Downtime:
Small business: $8,500/hour
Enterprise: $300,000-$400,000/hour
E-commerce: $5,600/minute during peak season
Customer Patience:
47% of users expect pages to load in 2 seconds or less
40% abandon sites that take more than 3 seconds
79% won't return to poorly performing sites
Market Examples:
Twitter (2008): Fail Whale became synonymous with poor scalability. Cost: millions in lost revenue, damaged reputation.
Instagram (2012): Built on Django with smart caching. Handled 30 million users with just 13 engineers because of scalable architecture.
Robinhood (2021): App crashed during GameStop surge. Lost users, faced lawsuits, damaged credibility.
The lesson? Scalability is cheaper to build in than to retrofit.

Understanding Scalability: Vertical vs Horizontal
Vertical Scaling (Scaling Up)
Definition: Adding more power to your existing server (more CPU, RAM, storage).
Pros:
✅ Simple to implement
✅ No code changes needed
✅ Good for databases (single-server transactions)
✅ Lower latency (everything on one machine)
Cons:
❌ Hardware limits (can't scale infinitely)
❌ Expensive at higher tiers
❌ Single point of failure
❌ Downtime during upgrades
When to Use:
Early-stage applications (under 10K users)
Monolithic architectures
Database-heavy workloads requiring ACID transactions
Legacy applications difficult to modify
Cost Example:
Small server: $50/month (2 CPU, 4GB RAM)
Large server: $800/month (32 CPU, 128GB RAM)
16x cost increase for 16x capacity
Horizontal Scaling (Scaling Out)
Definition: Adding more servers to distribute the load.
Pros:
✅ Nearly unlimited scalability
✅ Better fault tolerance (one server fails, others continue)
✅ Cost-effective (add small servers as needed)
✅ Easier rollbacks and updates
Cons:
❌ More complex architecture
❌ Requires code changes (stateless design)
❌ Data consistency challenges
❌ Load balancing overhead
When to Use:
High-traffic applications (10K+ concurrent users)
Microservices architectures
Cloud-native applications
Applications with variable traffic patterns
Cost Example:
10 small servers: $500/month total
Same capacity as large server but more resilient
Can scale to 100 servers ($5,000/month) for 10x capacity
The 2025 Best Practice: Start vertical, plan horizontal. Build with horizontal in mind even if you start small.
Architecture Patterns for Scalable Applications
Pattern 1: Monolithic → Modular → Microservices
Monolithic Architecture:
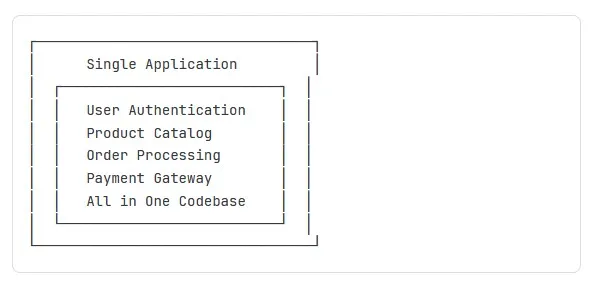
Pros: Simple, fast development initially
Cons: Scales as one unit, hard to maintain
Microservices Architecture:
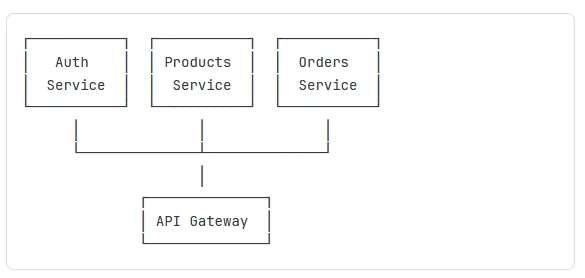
Pros: Independent scaling, isolated failures
Cons: Complex deployment, network overhead
When to Migrate:
Team size: 10+ developers
Traffic: 50K+ daily active users
Features: Adding new services monthly
Pattern 2: Stateless Application Design
The Problem with State:
javascript code
----
// ❌ BAD: Stateful (doesn't scale)
const express = require('express');
const app = express();

let sessionData = {}; // Stored in memory

app.post('/login', (req, res) => {
  const userId = req.body.userId;
  sessionData[userId] = { loggedIn: true, timestamp: Date.now() };
  res.send('Logged in');
});

app.get('/dashboard', (req, res) => {
  const userId = req.query.userId;
  if (sessionData[userId]) {
    res.send('Welcome to dashboard');
  } else {
    res.status(401).send('Not logged in');
  }
});
Why It Fails:
Server 1 stores login → Load balancer sends next request to Server 2 → User appears logged out
Memory-based storage lost on server restart
The Solution: Stateless with External Storage
javascript code
----
// ✅ GOOD: Stateless (scales horizontally)
const express = require('express');
const redis = require('redis');
const app = express();

// Shared Redis instance all servers access
const redisClient = redis.createClient({
  host: process.env.REDIS_HOST,
  port: 6379
});

app.post('/login', async (req, res) => {
  const userId = req.body.userId;
  const sessionToken = generateToken(); // JWT or UUID

  // Store in Redis (shared across all servers)
  await redisClient.setEx(
    `session:${sessionToken}`,
    3600, // 1 hour expiry
    JSON.stringify({ userId, loggedIn: true })
  );

  res.json({ token: sessionToken });
});

app.get('/dashboard', async (req, res) => {
  const token = req.headers.authorization;

  // Any server can check Redis
  const session = await redisClient.get(`session:${token}`);

  if (session) {
    res.send('Welcome to dashboard');
  } else {
    res.status(401).send('Not logged in');
  }
});
Benefits:
Any server can handle any request
Server crashes don't lose user sessions
Easy to add/remove servers
Redis handles millions of operations/second
Pattern 3: Database Read Replicas
The Problem: One database server handles all reads and writes → becomes bottleneck at scale.
The Solution: Primary server for writes, replica servers for reads.
python code
---
# Database connection with read replicas
from sqlalchemy import create_engine
from sqlalchemy.orm import sessionmaker
import random

# Primary database (for writes)
primary_engine = create_engine('postgresql://primary-db:5432/myapp')

# Read replicas (for reads)
replica_engines = [
    create_engine('postgresql://replica1-db:5432/myapp'),
    create_engine('postgresql://replica2-db:5432/myapp'),
    create_engine('postgresql://replica3-db:5432/myapp')
]

def get_write_session():
    """Use primary for writes"""
    Session = sessionmaker(bind=primary_engine)
    return Session()

def get_read_session():
    """Use random replica for reads"""
    engine = random.choice(replica_engines)
    Session = sessionmaker(bind=engine)
    return Session()

# Usage example
def create_user(name, email):
    # Writes go to primary
    session = get_write_session()
    user = User(name=name, email=email)
    session.add(user)
    session.commit()
    return user

def get_all_users():
    # Reads use replicas
    session = get_read_session()
    return session.query(User).all()

def get_user_orders(user_id):
    # Heavy read operation on replica
    session = get_read_session()
    return session.query(Order).filter_by(user_id=user_id).all()
Performance Impact:
Before: 1 server handles 1,000 queries/sec
After: 1 primary + 3 replicas handle 4,000 queries/sec
4x read capacity with minimal cost increase
Building Scalable Backend APIs
1. RESTful API Best Practices
Stateless API Design:
javascript code
---
const express = require('express');
const jwt = require('jsonwebtoken');
const app = express();

// ✅ Stateless authentication middleware
function authenticate(req, res, next) {
  const token = req.headers.authorization?.split(' ')[1];

  if (!token) {
    return res.status(401).json({ error: 'No token provided' });
  }

  try {
    // Verify JWT (stateless - no database lookup needed)
    const decoded = jwt.verify(token, process.env.JWT_SECRET);
    req.user = decoded; // Attach user info to request
    next();
  } catch (error) {
    res.status(401).json({ error: 'Invalid token' });
  }
}

// All API routes are stateless
app.get('/api/users/:id', authenticate, async (req, res) => {
  // Request contains all needed info (no server-side session)
  const userId = req.params.id;

  // Check authorization (user can only access own data)
  if (req.user.id !== userId && !req.user.isAdmin) {
    return res.status(403).json({ error: 'Forbidden' });
  }

  const user = await getUserById(userId);
  res.json(user);
});
2. Implementing Rate Limiting
Why: Prevent abuse, protect from DDoS, ensure fair resource allocation.
javascript code
---
const rateLimit = require('express-rate-limit');
const RedisStore = require('rate-limit-redis');
const redis = require('redis');

const redisClient = redis.createClient({
  host: process.env.REDIS_HOST
});

// Create rate limiter (stored in Redis for multi-server)
const apiLimiter = rateLimit({
  store: new RedisStore({
    client: redisClient,
    prefix: 'rate_limit:'
  }),
  windowMs: 15 * 60 * 1000, // 15 minutes
  max: 100, // 100 requests per window
  message: 'Too many requests, please try again later',
  standardHeaders: true, // Return rate limit info in headers
  legacyHeaders: false
});

// Apply to all API routes
app.use('/api/', apiLimiter);

// Stricter limit for expensive operations
const strictLimiter = rateLimit({
  store: new RedisStore({ client: redisClient }),
  windowMs: 60 * 60 * 1000, // 1 hour
  max: 10, // Only 10 requests per hour
  message: 'Export limit reached, try again in an hour'
});

app.post('/api/export-data', strictLimiter, async (req, res) => {
  // Expensive operation protected by strict rate limit
  const data = await generateLargeExport();
  res.json(data);
});
3. Async Processing with Message Queues
The Problem: Synchronous operations block API responses.
javascript code
---
// ❌ BAD: Synchronous processing
app.post('/api/send-email', async (req, res) => {
  const { to, subject, body } = req.body;

  // This takes 3-5 seconds - user waits!
  await sendEmail(to, subject, body);

  res.json({ message: 'Email sent' });
  // User waited 5 seconds for response
});
The Solution: Queue the job, respond immediately.
javascript code
---
// ✅ GOOD: Async with message queue
const Bull = require('bull');

// Create email queue (backed by Redis)
const emailQueue = new Bull('email', {
  redis: {
    host: process.env.REDIS_HOST,
    port: 6379
  }
});

// API endpoint queues job and responds immediately
app.post('/api/send-email', async (req, res) => {
  const { to, subject, body } = req.body;

  // Add job to queue (takes milliseconds)
  await emailQueue.add({
    to,
    subject,
    body
  });

  // Immediate response
  res.json({ message: 'Email queued for sending' });
  // User gets instant response!
});

// Background worker processes queue
emailQueue.process(async (job) => {
  const { to, subject, body } = job.data;

  // This can take as long as needed
  await sendEmail(to, subject, body);

  console.log(`Email sent to ${to}`);
});
Benefits:
API response time: 5 seconds → 50ms (100x faster)
Failed jobs automatically retry
Can scale workers independently
Jobs survive server restarts
Use Cases for Async Processing:
Email sending
Report generation
Image/video processing
Data exports
Push notifications
Third-party API calls
Database Optimization for Scale
1. Proper Indexing
The Impact of Indexes:
sql code
---
-- Table with 1 million users
CREATE TABLE users (
    id SERIAL PRIMARY KEY,
    email VARCHAR(255),
    name VARCHAR(255),
    created_at TIMESTAMP DEFAULT NOW()
);

-- ❌ WITHOUT INDEX: Slow query (800ms)
SELECT * FROM users WHERE email = 'john@example.com';
-- PostgreSQL scans ALL 1 million rows

-- ✅ WITH INDEX: Fast query (2ms)
CREATE INDEX idx_users_email ON users(email);
SELECT * FROM users WHERE email = 'john@example.com';
-- PostgreSQL uses index, finds row instantly
When to Add Indexes:
✅ Columns used in WHERE clauses
✅ Columns used in JOIN conditions
✅ Columns used for sorting (ORDER BY)
✅ Foreign key columns
When NOT to Index:
❌ Small tables (under 1,000 rows)
❌ Columns with low cardinality (gender: M/F)
❌ Frequently updated columns (indexes slow writes)
2. Database Connection Pooling
The Problem: Creating new database connections is expensive (50-100ms each).
javascript code
---
// ❌ BAD: New connection per request
const { Pool } = require('pg');

app.get('/api/users', async (req, res) => {
  // Creates new connection (slow!)
  const client = new Pool({
    host: 'localhost',
    database: 'myapp'
  });

  const result = await client.query('SELECT * FROM users');
  await client.end(); // Close connection

  res.json(result.rows);
});
javascrit code
---
// ✅ GOOD: Connection pool (reuse connections)
const { Pool } = require('pg');
// Create pool once at startup
const pool = new Pool({
host: process.env.DB_HOST,
database: process.env.DB_NAME,
user: process.env.DB_USER,
password: process.env.DB_PASSWORD,
max: 20, // Maximum 20 connections
idleTimeoutMillis: 30000,
connectionTimeoutMillis: 2000
});
// Reuse connections from pool
app.get('/api/users', async (req, res) => {
// Gets connection from pool (fast!)
const client = await pool.connect();
try {
const result = await client.query('SELECT * FROM users');
res.json(result.rows);
} finally {
client.release(); // Return to pool (not close!)
}
});Performance Impact:
Without pool: 50-100ms per request overhead
With pool: 1-2ms per request overhead
25-50x faster at scale
3. Caching with Redis
80/20 Rule: 20% of your data is accessed 80% of the time. Cache that 20%.
javascript code
---
const redis = require('redis');
const redisClient = redis.createClient();

// Cache-aside pattern
async function getUser(userId) {
  const cacheKey = `user:${userId}`;

  // Try cache first
  const cached = await redisClient.get(cacheKey);
  if (cached) {
    console.log('Cache HIT');
    return JSON.parse(cached);
  }

  // Cache miss - query database
  console.log('Cache MISS - querying database');
  const user = await db.query('SELECT * FROM users WHERE id = $1', [userId]);

  // Store in cache for 1 hour
  await redisClient.setEx(
    cacheKey,
    3600,
    JSON.stringify(user)
  );

  return user;
}

// Invalidate cache on update
async function updateUser(userId, data) {
  await db.query('UPDATE users SET name = $1 WHERE id = $2', [data.name, userId]);

  // Remove from cache so next read gets fresh data
  await redisClient.del(`user:${userId}`);
}
Cache Strategies:
Cache-Aside (Lazy Loading):
App checks cache first
On miss, loads from database
Updates cache
Best for: Read-heavy workloads
Write-Through:
App writes to cache and database simultaneously
Cache always up-to-date
Best for: Read and write heavy
Write-Behind:
App writes to cache immediately
Background process syncs to database
Best for: Write-heavy (beware data loss risk)
Frontend Performance at Scale
1. Code Splitting and Lazy Loading
The Problem: Loading entire app on first visit is slow.
javascript code
---
// ❌ BAD: Load everything upfront
import Dashboard from './components/Dashboard';
import Analytics from './components/Analytics';
import Settings from './components/Settings';
import Admin from './components/Admin';

function App() {
  return (
    <Router>
      <Route path="/dashboard" component={Dashboard} />
      <Route path="/analytics" component={Analytics} />
      <Route path="/settings" component={Settings} />
      <Route path="/admin" component={Admin} />
    </Router>
  );
}
// Bundle size: 2.5MB - takes 8 seconds on 3G
// ✅ GOOD: Lazy load routes
import { lazy, Suspense } from 'react';
// Only load when user visits route
const Dashboard = lazy(() => import('./components/Dashboard'));
const Analytics = lazy(() => import('./components/Analytics'));
const Settings = lazy(() => import('./components/Settings'));
const Admin = lazy(() => import('./components/Admin'));
function App() {
return (
<Router>
<Suspense fallback={<LoadingSpinner />}>
<Route path="/dashboard" component={Dashboard} />
<Route path="/analytics" component={Analytics} />
<Route path="/settings" component={Settings} />
<Route path="/admin" component={Admin} />
</Suspense>
</Router>
);
}
// Initial bundle: 400KB - loads in 1.5 seconds
// Other routes load on demandImpact:
Initial load: 8s → 1.5s (5.3x faster)
User sees content sooner
Less bandwidth waste (don't load Admin if user isn't admin)
2. Image Optimization
javascript code
---
// ✅ Modern image optimization
<picture>
  {/* WebP for modern browsers (30-50% smaller) */}
  <source srcSet="/image.webp" type="image/webp" />

  {/* Fallback for older browsers */}
  <img
    src="/image.jpg"
    alt="Product"
    loading="lazy" // Lazy load below-the-fold images
    width="800"
    height="600"
  />
</picture>

// Responsive images (serve appropriate size)
<img
  src="/image-small.jpg"
  srcSet="
    /image-small.jpg 400w,
    /image-medium.jpg 800w,
    /image-large.jpg 1200w
  "
  sizes="(max-width: 600px) 400px, (max-width: 1024px) 800px, 1200px"
  alt="Product"
/>
Optimization Checklist:
✅ Use WebP format (30-50% smaller than JPEG)
✅ Lazy load images below the fold
✅ Serve responsive images (don't send 4K to mobile)
✅ Compress images (TinyPNG, ImageOptim)
✅ Use CDN for images
3. Content Delivery Network (CDN)
Without CDN
User in Tokyo → Request → Your server in US → 250ms latency
User in London → Request → Your server in US → 100ms latency
With CDN
User in Tokyo → CDN edge in Tokyo → 15ms latency
User in London → CDN edge in London → 10ms latency
CDN Setup (Cloudflare Example):
Sign up for Cloudflare
Point your domain's nameservers to Cloudflare
Enable caching rules:
javascript code
---
// Set cache headers on your server
app.use('/static', express.static('public', {
  maxAge: '1y', // Cache static assets for 1 year
  immutable: true
}));

app.get('/api/products', (req, res) => {
  res.set('Cache-Control', 'public, max-age=300'); // Cache API for 5 min
  res.json(products);
});
Benefits:
80-90% faster load times globally
Reduced server bandwidth (CDN serves cached content)
DDoS protection
Automatic image optimization
Load Balancing and High Availability
Load Balancer Configuration
What It Does: Distributes incoming traffic across multiple servers.
NGINX Load Balancer:
nginx code
---
# /etc/nginx/nginx.conf

http {
    # Define upstream servers
    upstream backend {
        # Round-robin (default)
        server backend1.example.com:3000;
        server backend2.example.com:3000;
        server backend3.example.com:3000;

        # Health checks
        keepalive 32;
    }

    server {
        listen 80;
        server_name example.com;

        location / {
            proxy_pass http://backend;
            proxy_set_header Host $host;
            proxy_set_header X-Real-IP $remote_addr;

            # Connection keep-alive
            proxy_http_version 1.1;
            proxy_set_header Connection "";
        }
    }
}
Load Balancing Algorithms:
Round Robin (Default):
Request 1 → Server 1
Request 2 → Server 2
Request 3 → Server 3
Request 4 → Server 1 (cycle repeats)
Least Connections:
nginx code
---
upstream backend {
    least_conn; # Send to server with fewest active connections
    server backend1.example.com;
    server backend2.example.com;
    server backend3.example.com;
}
IP Hash (Sticky Sessions):
nginx code
---
upstream backend {
    ip_hash; # Same user always goes to same server
    server backend1.example.com;
    server backend2.example.com;
    server backend3.example.com;
}
Health Checks and Failover
nginx code
---
upstream backend {
    server backend1.example.com max_fails=3 fail_timeout=30s;
    server backend2.example.com max_fails=3 fail_timeout=30s;
    server backend3.example.com backup; # Only used if others fail
}
How It Works:
NGINX sends request to backend1
If backend1 fails 3 times in 30 seconds → mark unhealthy
Stop sending traffic to backend1
After 30 seconds, try backend1 again
If successful → mark healthy, resume traffic
Monitoring and Observability
Application Performance Monitoring (APM)
What to Monitor:
1. Response Time:
javascript code
---
const express = require('express');
const app = express();

// Custom middleware to track response time
app.use((req, res, next) => {
  const start = Date.now();

  res.on('finish', () => {
    const duration = Date.now() - start;
    console.log(`${req.method} ${req.url} - ${duration}ms`);

    // Alert if slow
    if (duration > 1000) {
      console.error(`SLOW REQUEST: ${req.url} took ${duration}ms`);
    }
  });

  next();
});
2. Error Tracking:
javascript code
---
const Sentry = require('@sentry/node');

Sentry.init({
  dsn: process.env.SENTRY_DSN,
  environment: process.env.NODE_ENV
});

// Catch all errors
app.use(Sentry.Handlers.errorHandler());

// Example error
app.get('/api/risky-operation', async (req, res) => {
  try {
    const result = await riskyDatabaseOperation();
    res.json(result);
  } catch (error) {
    // Sentry automatically captures and reports
    Sentry.captureException(error);
    res.status(500).json({ error: 'Internal server error' });
  }
});
3. Custom Metrics:
javascript code
---
const promClient = require('prom-client');

// Create custom metric
const httpRequestDuration = new promClient.Histogram({
  name: 'http_request_duration_seconds',
  help: 'Duration of HTTP requests in seconds',
  labelNames: ['method', 'route', 'status_code']
});

// Track metrics
app.use((req, res, next) => {
  const end = httpRequestDuration.startTimer();

  res.on('finish', () => {
    end({
      method: req.method,
      route: req.route?.path || req.path,
      status_code: res.statusCode
    });
  });

  next();
});

// Expose metrics endpoint for Prometheus
app.get('/metrics', async (req, res) => {
  res.set('Content-Type', promClient.register.contentType);
  res.end(await promClient.register.metrics());
});
Key Metrics to Track:
Key Metrics to Track:
Metric | Target | Alert Threshold |
|---|---|---|
Response Time (p95) | <200ms | >500ms |
Error Rate | <0.1% | >1% |
Uptime | 99.9% | <99% |
CPU Usage | <70% | >85% |
Memory Usage | <80% | >90% |
Database Connections | <80% of pool | >95% |
Load Testing: Validating Scalability
Tools and Techniques
1. Apache Bench (Simple)
bash
---
# Test 10,000 requests with 100 concurrent connections
ab -n 10000 -c 100 http://localhost:3000/api/users

# Results show:
# - Requests per second
# - Time per request
# - Transfer rate
# - Connection times
2. k6 (Modern, Powerful)
// loadtest.js
import http from 'k6/http';
import { check, sleep } from 'k6';

export const options = {
  stages: [
    { duration: '2m', target: 100 }, // Ramp up to 100 users
    { duration: '5m', target: 100 }, // Stay at 100 for 5 min
    { duration: '2m', target: 200 }, // Ramp to 200
    { duration: '5m', target: 200 }, // Stay at 200
    { duration: '2m', target: 0 },   // Ramp down
  ],
  thresholds: {
    http_req_duration: ['p(95)<500'], // 95% of requests under 500ms
    http_req_failed: ['rate<0.01'],   // Less than 1% errors
  },
};

export default function () {
  const res = http.get('http://localhost:3000/api/users');

  check(res, {
    'status is 200': (r) => r.status === 200,
    'response time < 500ms': (r) => r.timings.duration < 500,
  });

  sleep(1);
}
bash
---
# Run load test
k6 run loadtest.js
# Output shows:
# ✓ http_req_duration..............: avg=287ms p(95)=456ms
# ✓ http_req_failed................: 0.23%
# ✗ Some thresholds failed (see above)3. Interpreting Results
Good Performance:
Requests per second: 1,000+
Response time (p95): <500ms
Error rate: <0.1%
CPU usage: <75%
Memory: Stable (no leaks)
Warning Signs:
Requests per second: Decreasing over time
Response time (p95): >1000ms
Error rate: >1%
CPU usage: >90%
Memory: Increasing (memory leak)
Database connections: Maxed out
What to Do When Tests Fail:
Identify Bottleneck:
Check APM tools (New Relic, Datadog)
Review server metrics (CPU, memory, disk I/O)
Check database slow query logs
Common Fixes:
Add database indexes
Implement caching
Optimize slow queries
Add more servers (horizontal scaling)
Upgrade server resources (vertical scaling)
Re-test:
Apply fix
Run load test again
Verify improvement
Repeat until targets met
CI/CD for Scalable Deployments
Zero-Downtime Deployment Strategy
The Goal: Deploy new code without users noticing.
Rolling Deployment:
yaml
--
# .github/workflows/deploy.yml
name: Deploy to Production

on:
  push:
    branches: [main]

jobs:
  deploy:
    runs-on: ubuntu-latest
    steps:
      - uses: actions/checkout@v2

      - name: Run Tests
        run: npm test

      - name: Build Docker Image
        run: |
          docker build -t myapp:${{ github.sha }} .
          docker tag myapp:${{ github.sha }} myapp:latest

      - name: Push to Registry
        run: docker push myapp:latest

      - name: Rolling Update (Kubernetes)
        run: |
          kubectl set image deployment/myapp \
            myapp=myapp:${{ github.sha }} \
            --record
          kubectl rollout status deployment/myapp
Blue-Green Deployment:
bash
--
# Current production (Blue environment)
# Running version 1.0 with all traffic

# Deploy to Green environment (new version 2.0)
kubectl apply -f deployment-green.yaml

# Wait for Green to be healthy
kubectl wait --for=condition=ready pod -l version=2.0

# Switch traffic from Blue to Green
kubectl patch service myapp -p '{"spec":{"selector":{"version":"2.0"}}}'

# Monitor for issues
# If problems: switch back to Blue immediately
# If stable: decommission Blue environment
Benefits:
Zero downtime
Instant rollback if issues
Test new version before switching traffic
Safe for critical production systems
Cloud Deployment Strategies
AWS Architecture for Scalability
Basic Scalable Architecture:
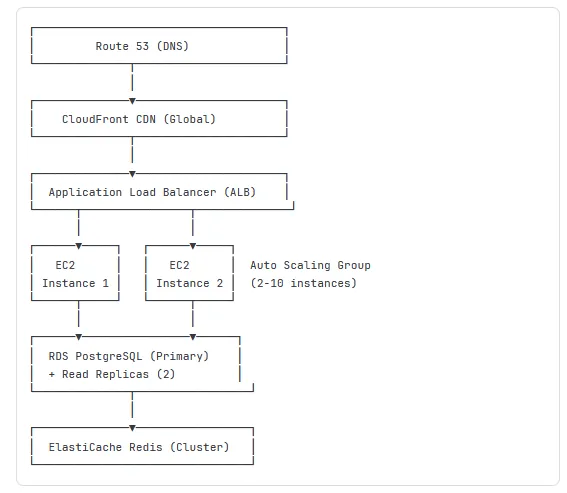
Terraform Configuration:
hcl
--
# terraform/main.tf

# Auto Scaling Group
resource "aws_autoscaling_group" "app" {
  name                 = "app-asg"
  vpc_zone_identifier  = var.subnet_ids
  min_size             = 2
  max_size             = 10
  desired_capacity     = 2

  launch_template {
    id      = aws_launch_template.app.id
    version = "$Latest"
  }

  tag {
    key                 = "Name"
    value               = "app-server"
    propagate_at_launch = true
  }
}

# Scaling Policy (CPU-based)
resource "aws_autoscaling_policy" "scale_up" {
  name                   = "scale-up"
  scaling_adjustment     = 2
  adjustment_type        = "ChangeInCapacity"
  cooldown               = 300
  autoscaling_group_name = aws_autoscaling_group.app.name
}

# CloudWatch Alarm (trigger scaling)
resource "aws_cloudwatch_metric_alarm" "cpu_high" {
  alarm_name          = "cpu-utilization-high"
  comparison_operator = "GreaterThanThreshold"
  evaluation_periods  = "2"
  metric_name         = "CPUUtilization"
  namespace           = "AWS/EC2"
  period              = "120"
  statistic           = "Average"
  threshold           = "75"

  dimensions = {
    AutoScalingGroupName = aws_autoscaling_group.app.name
  }

  alarm_actions = [aws_autoscaling_policy.scale_up.arn]
}

# RDS with Read Replicas
resource "aws_db_instance" "primary" {
  identifier           = "myapp-db-primary"
  engine               = "postgres"
  engine_version       = "15.3"
  instance_class       = "db.t3.medium"
  allocated_storage    = 100
  storage_encrypted    = true
  multi_az             = true  # High availability

  backup_retention_period = 7
  backup_window          = "03:00-04:00"

  tags = {
    Name = "Primary Database"
  }
}

resource "aws_db_instance" "replica" {
  count                = 2
  identifier           = "myapp-db-replica-${count.index + 1}"
  replicate_source_db  = aws_db_instance.primary.identifier
  instance_class       = "db.t3.medium"
  publicly_accessible  = false

  tags = {
    Name = "Read Replica ${count.index + 1}"
  }
}
Cost Optimization Tips:
Use Reserved Instances: Save 40-60% vs on-demand for predictable workloads
Auto-Scaling: Only run servers you need (scale down at night)
Right-Sizing: Start with t3.medium, adjust based on monitoring
Spot Instances: Save 70-90% for non-critical batch jobs
S3 Lifecycle Policies: Move old data to cheaper storage tiers
Security at Scale
API Security Checklist
1. Input Validation
javascript code
---
const Joi = require('joi');

// Define validation schema
const userSchema = Joi.object({
  email: Joi.string().email().required(),
  name: Joi.string().min(2).max(50).required(),
  age: Joi.number().integer().min(18).max(120)
});

app.post('/api/users', async (req, res) => {
  // Validate input
  const { error, value } = userSchema.validate(req.body);

  if (error) {
    return res.status(400).json({
      error: error.details[0].message
    });
  }

  // Proceed with validated data
  const user = await createUser(value);
  res.json(user);
});
2. SQL Injection Prevention
javascript code
--
// ❌ VULNERABLE to SQL injection
app.get('/api/users', (req, res) => {
  const name = req.query.name;
  // Attacker can send: name=' OR '1'='1
  const query = `SELECT * FROM users WHERE name = '${name}'`;
  db.query(query); // Executes: SELECT * FROM users WHERE name = '' OR '1'='1'
  // Returns all users!
});

// ✅ SAFE: Parameterized queries
app.get('/api/users', async (req, res) => {
  const name = req.query.name;

  // Use placeholders
  const query = 'SELECT * FROM users WHERE name = $1';
  const result = await db.query(query, [name]);
  // Even if name is malicious, treated as literal string

  res.json(result.rows);
});
3. Authentication & Authorization
javascript code
---
const bcrypt = require('bcrypt');
const jwt = require('jsonwebtoken');

// Register user
app.post('/api/register', async (req, res) => {
  const { email, password } = req.body;

  // Hash password (never store plaintext!)
  const hashedPassword = await bcrypt.hash(password, 10);

  const user = await db.query(
    'INSERT INTO users (email, password_hash) VALUES ($1, $2) RETURNING id',
    [email, hashedPassword]
  );

  res.json({ id: user.rows[0].id });
});

// Login
app.post('/api/login', async (req, res) => {
  const { email, password } = req.body;

  const result = await db.query(
    'SELECT * FROM users WHERE email = $1',
    [email]
  );

  if (result.rows.length === 0) {
    return res.status(401).json({ error: 'Invalid credentials' });
  }

  const user = result.rows[0];
  const validPassword = await bcrypt.compare(password, user.password_hash);

  if (!validPassword) {
    return res.status(401).json({ error: 'Invalid credentials' });
  }

  // Generate JWT
  const token = jwt.sign(
    { userId: user.id, email: user.email },
    process.env.JWT_SECRET,
    { expiresIn: '24h' }
  );

  res.json({ token });
});

// Protected route
app.get('/api/profile', authenticate, async (req, res) => {
  // req.user populated by authenticate middleware
  const user = await db.query(
    'SELECT id, email, name FROM users WHERE id = $1',
    [req.user.userId]
  );

  res.json(user.rows[0]);
});
4. HTTPS Enforcement
javascript code
---
// Redirect HTTP to HTTPS
app.use((req, res, next) => {
  if (req.header('x-forwarded-proto') !== 'https') {
    res.redirect(`https://${req.header('host')}${req.url}`);
  } else {
    next();
  }
});

// Set security headers
const helmet = require('helmet');
app.use(helmet());

// Results in headers like:
// Strict-Transport-Security: max-age=31536000
// X-Content-Type-Options: nosniff
// X-Frame-Options: DENY
Cost Optimization Strategies
Resource Right-Sizing
Monitor Actual Usage:
javascript code
---
// Track actual resource utilization
const os = require('os');

setInterval(() => {
  const cpuUsage = process.cpuUsage();
  const memUsage = process.memoryUsage();

  console.log({
    cpu: {
      user: cpuUsage.user / 1000000, // Convert to seconds
      system: cpuUsage.system / 1000000
    },
    memory: {
      used: Math.round(memUsage.heapUsed / 1024 / 1024), // MB
      total: Math.round(os.totalmem() / 1024 / 1024),
      percent: Math.round((memUsage.heapUsed / os.totalmem()) * 100)
    }
  });
}, 60000); // Every minute
Example Analysis:
Current setup: 4 x c5.2xlarge (8 vCPU, 16GB RAM each) = $1,100/month
Actual usage: Average 35% CPU, 45% memory

Recommendation: 6 x c5.large (2 vCPU, 4GB RAM each) = $550/month
Result: Same capacity, 50% cost savings
Auto-Scaling Configuration
javascript code
---
// AWS SDK example
const AWS = require('aws-sdk');
const autoscaling = new AWS.AutoScaling();

// Configure scaling based on multiple metrics
const scalingPolicy = {
  PolicyName: 'intelligent-scaling',
  AutoScalingGroupName: 'app-asg',
  PolicyType: 'TargetTrackingScaling',
  TargetTrackingConfiguration: {
    PredefinedMetricSpecification: {
      PredefinedMetricType: 'ASGAverageCPUUtilization'
    },
    TargetValue: 70.0, // Keep CPU around 70%
    ScaleInCooldown: 300,  // Wait 5 min before scaling down
    ScaleOutCooldown: 60   // Wait 1 min before scaling up again
  }
};

// Also scale based on network traffic
const networkScalingPolicy = {
  PolicyName: 'network-scaling',
  AutoScalingGroupName: 'app-asg',
  PolicyType: 'TargetTrackingScaling',
  TargetTrackingConfiguration: {
    PredefinedMetricSpecification: {
      PredefinedMetricType: 'ASGAverageNetworkIn'
    },
    TargetValue: 10000000.0, // 10 MB/s
  }
};
Scheduled Scaling (Predictable Patterns):
javascript code
---
// Scale up before business hours
const morningScale = {
  ScheduledActionName: 'morning-scale-up',
  AutoScalingGroupName: 'app-asg',
  Recurrence: '0 8 * * MON-FRI', // 8 AM weekdays
  MinSize: 4,
  DesiredCapacity: 6
};

// Scale down after business hours
const eveningScale = {
  ScheduledActionName: 'evening-scale-down',
  AutoScalingGroupName: 'app-asg',
  Recurrence: '0 20 * * *', // 8 PM daily
  MinSize: 2,
  DesiredCapacity: 2
};
Cost Savings:
Business hours (12 hrs): 6 servers
Off hours (12 hrs): 2 servers
Average: 4 servers vs. running 6 constantly
Savings: 33% infrastructure cost
Common Scalability Challenges and Solutions
Challenge 1: Database Becomes Bottleneck
Symptoms:
Slow queries even with indexes
Connection pool exhausted
High database CPU usage
Long query queues
Solutions:
A. Read Replicas (Covered Earlier) Split reads across multiple databases.
B. Database Sharding
javascript code
---
// Horizontal partitioning by user ID
function getShardForUser(userId) {
  const numShards = 4;
  const shardId = userId % numShards;

  const shards = [
    'postgresql://shard0.example.com/db',
    'postgresql://shard1.example.com/db',
    'postgresql://shard2.example.com/db',
    'postgresql://shard3.example.com/db'
  ];

  return shards[shardId];
}

async function getUserOrders(userId) {
  const shardUrl = getShardForUser(userId);
  const db = new Pool({ connectionString: shardUrl });

  return await db.query(
    'SELECT * FROM orders WHERE user_id = $1',
    [userId]
  );
}
C. Move to NoSQL for Specific Use Cases
javascript code
---
// High-write workload? Use Cassandra
const cassandra = require('cassandra-driver');

const client = new cassandra.Client({
  contactPoints: ['cassandra1', 'cassandra2'],
  localDataCenter: 'datacenter1'
});

// Write-heavy operations
async function logEvent(userId, eventType, data) {
  const query = 'INSERT INTO events (user_id, event_type, timestamp, data) VALUES (?, ?, ?, ?)';
  await client.execute(query, [userId, eventType, Date.now(), data], {
    prepare: true
  });
}

// Cassandra handles millions of writes per second
Challenge 2: Session Management Across Servers
Problem: User logs in on Server 1, next request goes to Server 2, appears logged out.
Solution: Shared Session Store
javascript code
---
const session = require('express-session');
const RedisStore = require('connect-redis')(session);
const redis = require('redis');

const redisClient = redis.createClient({
  host: process.env.REDIS_HOST,
  port: 6379
});

app.use(session({
  store: new RedisStore({ client: redisClient }),
  secret: process.env.SESSION_SECRET,
  resave: false,
  saveUninitialized: false,
  cookie: {
    secure: true, // HTTPS only
    httpOnly: true, // Prevent XSS
    maxAge: 24 * 60 * 60 * 1000 // 24 hours
  }
}));

// Now sessions work across all servers
app.post('/login', (req, res) => {
  req.session.userId = user.id;
  res.json({ success: true });
});

app.get('/dashboard', (req, res) => {
  if (!req.session.userId) {
    return res.status(401).json({ error: 'Not logged in' });
  }
  // Works regardless of which server handles request
  res.json({ userId: req.session.userId });
});
Challenge 3: File Upload at Scale
Problem: Uploading to server disk doesn't work with multiple servers.
Solution: Cloud Storage (S3)
javascript code
---
const AWS = require('aws-sdk');
const multer = require('multer');
const multerS3 = require('multer-s3');

const s3 = new AWS.S3({
  accessKeyId: process.env.AWS_ACCESS_KEY,
  secretAccessKey: process.env.AWS_SECRET_KEY
});

// Upload directly to S3 (not server disk)
const upload = multer({
  storage: multerS3({
    s3: s3,
    bucket: 'myapp-uploads',
    acl: 'public-read',
    metadata: (req, file, cb) => {
      cb(null, { fieldName: file.fieldname });
    },
    key: (req, file, cb) => {
      const fileName = `${Date.now()}-${file.originalname}`;
      cb(null, fileName);
    }
  }),
  limits: {
    fileSize: 10 * 1024 * 1024 // 10MB max
  }
});

app.post('/api/upload', upload.single('file'), (req, res) => {
  // File automatically uploaded to S3
  res.json({
    url: req.file.location, // S3 URL
    size: req.file.size
  });
});
Benefits:
Works across multiple servers
Unlimited storage capacity
Built-in CDN (CloudFront)
Automatic backups and redundancy
Measuring Success: KPIs for Scalable Apps
Performance Metrics
Metric | Target | How to Measure |
|---|---|---|
Response Time (p95) | <300ms | APM tools, load tests |
Throughput | 1,000+ req/sec | Load tests, server logs |
Error Rate | <0.1% | Error monitoring (Sentry) |
Uptime | 99.9%+ | Status page monitoring |
Time to First Byte | <200ms | Browser dev tools |
Database Query Time | <50ms | Slow query logs |
Scalability Metrics
Metric | Good | Excellent |
|---|---|---|
Horizontal Scalability | 2x users = 2x servers | 2x users = 1.5x servers |
Cost per User | Decreasing | Significantly decreasing |
Auto-Scale Response | <5 minutes | <2 minutes |
Cache Hit Rate | >70% | >85% |
Business Metrics
javascript code
---
// Track business impact of performance
const metrics = {
  conversionRate: {
    fast: 3.2, // <1s load time
    slow: 1.8  // >3s load time
  },
  // Fast sites convert 78% better!

  revenuePerUser: {
    fast: 45.20,
    slow: 32.10
  },
  // Fast sites generate 41% more revenue per user

  bounceRate: {
    fast: 25,
    slow: 52
  }
  // Slow sites lose 52% of visitors immediately
};
Conclusion: Your Scalability Roadmap
Building scalable applications isn't about implementing every technique at once—it's about strategic planning and iterative improvement.
Phase 1: Foundation (0-1,000 users)
✅ Choose scalable architecture patterns (stateless, microservices-ready)
✅ Implement proper database indexing
✅ Use connection pooling
✅ Write clean, modular code
✅ Set up basic monitoring
Phase 2: Growth (1,000-10,000 users)
✅ Add caching layer (Redis)
✅ Implement CDN for static assets
✅ Set up database read replicas
✅ Add load balancer
✅ Implement auto-scaling
Phase 3: Scale (10,000-100,000 users)
✅ Move to microservices architecture
✅ Implement message queues (async processing)
✅ Add multiple cache layers
✅ Database sharding if needed
✅ Multi-region deployment
Phase 4: Enterprise (100,000+ users)
✅ Advanced caching strategies
✅ Custom CDN configuration
✅ Database optimization (NoSQL where appropriate)
✅ Dedicated DevOps team
✅ Advanced monitoring and alerting
Remember:
Measure before optimizing - Don't guess, use data
Start simple, scale gradually - Don't over-engineer early
Monitor everything - You can't improve what you don't measure
Test at scale - Load testing catches issues before users do
Plan for failure - Servers crash, design for resilience
Scalability is a journey, not a destination. Your application will evolve, traffic patterns will change, and new technologies will emerge. Build systems that can adapt.
The code examples, patterns, and strategies in this guide are proven in production across thousands of applications. Apply them thoughtfully, test thoroughly, and scale confidently.
Never Miss an Update
Join thousands of readers getting the latest insights on technology, business, and digital marketing.